Discover how ZEDEDA turns complex edge AI orchestration into a repeatable, scalable process—from first deployment to effortless updates across every node.
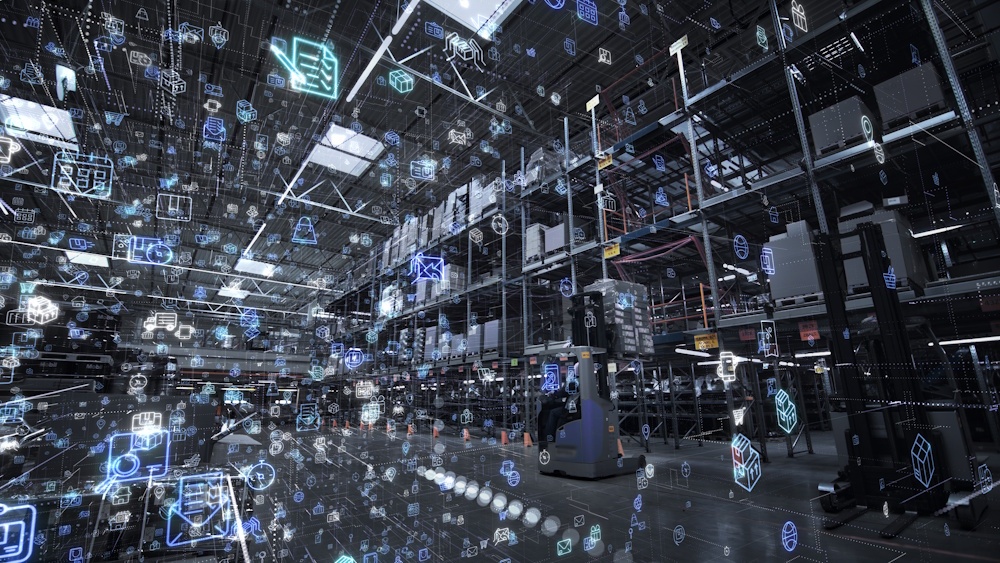
Edge environments demand simplicity and scale. This demo illustrates how a common object recognition use case–detecting people, cars or safety equipment–can be deployed and scaled consistently across edge environments. The goal: make it easy to run computer vision inference at the edge, manage it centrally, and scale from a single node to a global fleet while keeping everything observable, updatable, and resilient.
In this ZEDEDA Edge Field Day Showcase, Solutions Architect Sergio Santos demonstrates how ZEDEDA simplifies deploying and managing edge AI for computer vision. Using ZEDEDA’s orchestration platform, the demo walks through deploying a Docker Compose stack of three applications–an AI inference container (built with PyTorch and an open-source detr-ResNet model), Prometheus for local inference data persistence, and Grafana for data visualization–across a fleet of three edge devices (one GPU-enabled and two CPU-only). With automated deployment policies, ZEDEDA ensures each device receives the right configuration without manual setup.
The Pattern: Three containers, one outcome
We run a simple, powerful stack:
- Inference + business logic (single container): A PyTorch-based pipeline using an open-source ResNet model performs object detection and immediately exposes results to the local app logic, without extra sidecars or cross-container hops. If an NVIDIA GPU is present, the container automatically leverages CUDA framework from NVIDIA; if not, it runs on CPU. Same image, two execution paths.
- Prometheus (time-series database): Inference metrics are scraped locally and stored on the device. That matters in disconnected or bandwidth-constrained environments (ships at sea, remote industrial sites) where you still need local dashboards and alarms.
- Grafana (local visualization): Operators get a live dashboard and historical trends without depending on the cloud.
The Inference+Business logic is defined in a Docker Compose runtime that includes already and the necessary NVIDIA cuda drivers in case the device is equipped with a GPU. Camera feeds are simple configuration parameters in the docker compose file; credentials and secrets are automatically injected by the cloud controller; and if the device exposes CUDA, the compose file mounts the GPU accordingly.
Day 0 to Day 2+: Declare once, deploy anywhere
We don’t “hand install” apps on boxes. Instead, we declare desired state and let policy handle the rest:
- Marketplace apps: The three components (inference, Prometheus, Grafana) live as curated, versioned app definitions.
- Deployment project & policies: A project describes what belongs on a class of edge nodes. Policies handle variants (e.g., GPU nodes get the GPU-enabled inference image; non-GPU nodes get the CPU build). The device deployment tags drive the match.
- Terraform for nodes: We automate the edge-node creation by declaring them on the controller using Terraform. Part of this terraform automated configuration includes IP addresses, device deployment tags, GPU present or not and associate them with the corresponding deployment project & plocies. The controller provisions the full app stack automatically when nodes come online.
The result: bring up the devices and watch nine app instances (3× per node) deploy themselves across the fleet, without the need for manual SSH, no snowflake setups.
Live View: Proof it’s working (and fast)
Once the stack is up:
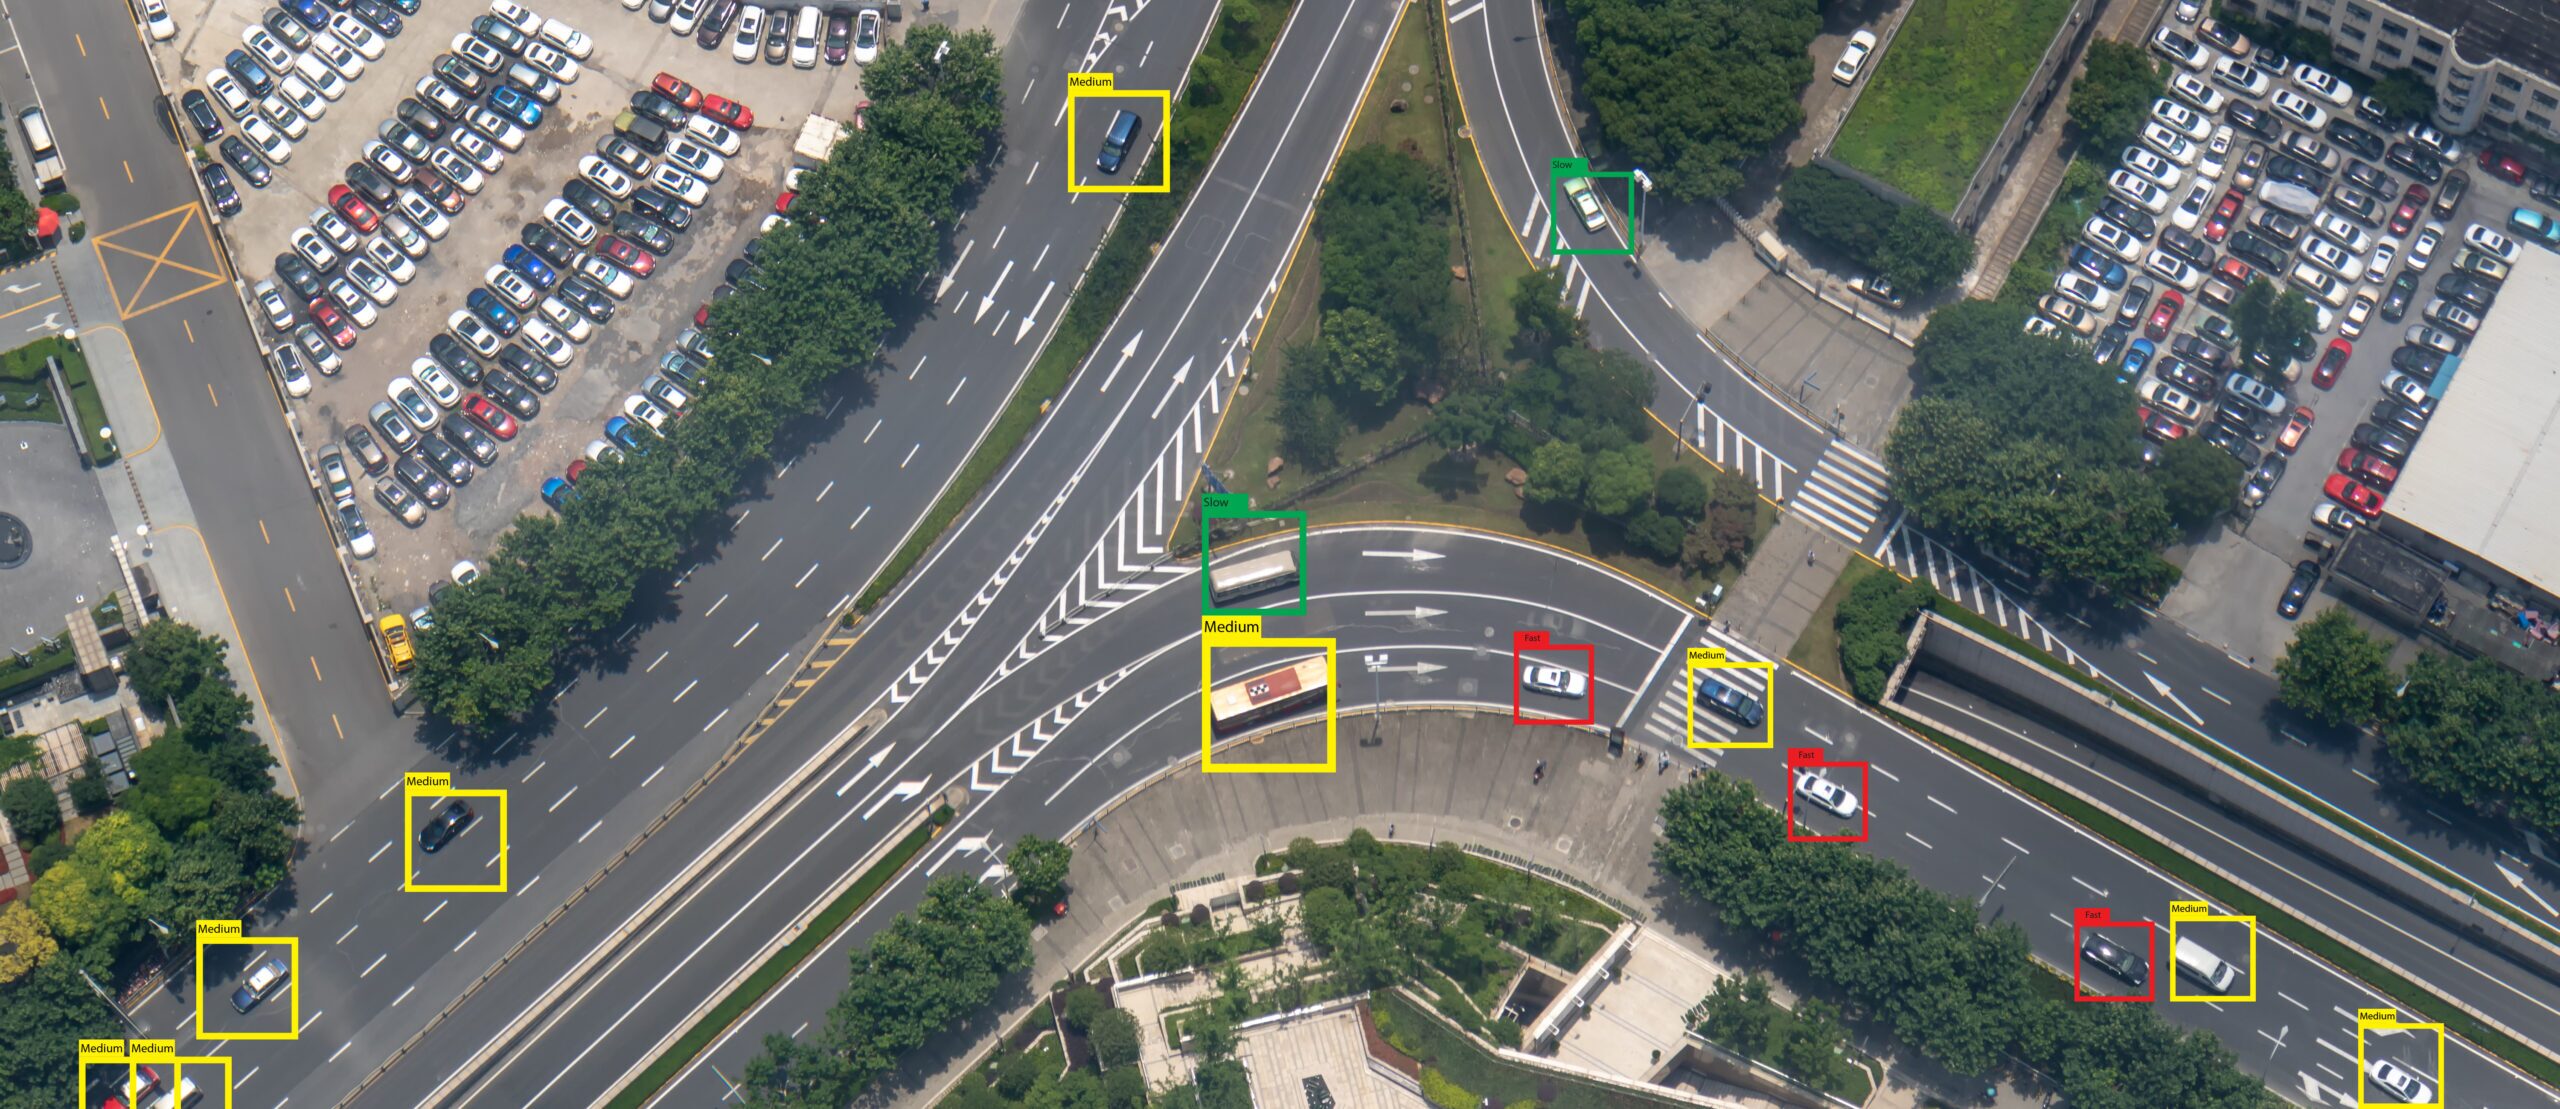
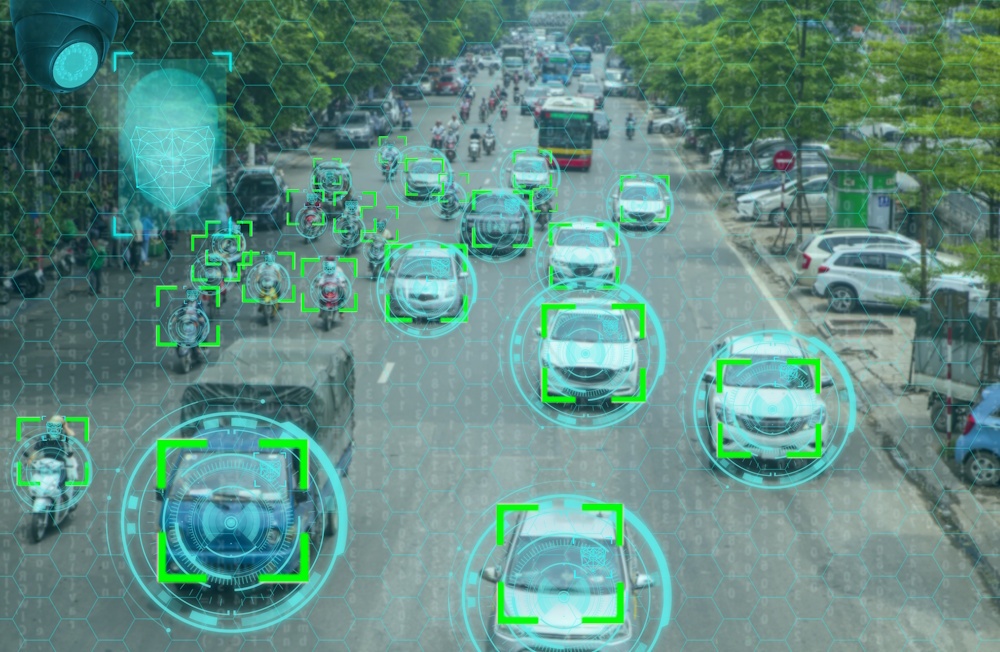
- Browse to the inference container’s web UI (port 8000) to see the camera stream annotated with detections, e.g., cars, people, buses, and live statistics.
- On a GPU-equipped node, the detection cadence is visibly faster. We can even confirm with nvidia-smi: the Python process in the container is actively using the GPU.
- Grafana trends the Prometheus counters so you can analyze detection rates over time, correlate by camera, or set thresholds and alerts.
Fleet-safe Updates (and Rollbacks) Without Downtime
Updates are lightweight and controlled:
- Change an image tag in policy and push, no docker runtime restart required. The edge agent applies the new version and reports state back to the controller (e.g., “now running draft-02”).
- If anything looks off, roll back by flipping the tag to the previous version. Policies and tags make phased rollouts straightforward (move a subset of nodes to the new policy before promoting globally).
Remote Ops, Logs, and Telemetry
From the same control plane:
- Open a remote session to a node (even behind a firewall or proxy) for validation or troubleshooting.
- Aggregate logs from the inference service and exporters (what objects were detected, at what rate).
- Watch CPU, memory, and network utilization to understand workload and camera traffic patterns and to right-size hardware.
Decommission Cleanly
When a site’s trial ends or a device needs repurposing, just move the node back to a default project. The stack tears down, leaving a clean system—no artifact scavenger hunts.
Why this matters:
What’s hard in edge AI isn’t just the model, it’s repeatability, resilience, and control:
- One image, two paths: GPU when available, CPU when not, no forked deployment logic.
- Local-first reliability: Dashboards and alerts work even when the link is down.
- GitOps-friendly at scale: Declarative nodes and policies replace ad-hoc setups.
- Safe iteration: Fast, reversible updates across many sites.
If you’re wrestling with getting computer vision out of the lab and into real-world environments, such as retail, industrial, maritime, this is the blueprint.
Want to see the full flow in action, including live detections, policy-driven rollout to GPU and non-GPU nodes, instant updates, and rollbacks? Watch the full demo video and follow along as the stack goes from “no nodes” to a fully instrumented fleet in minutes.